Staatliche Schulden, insgesamt (% des BIP) Ranking
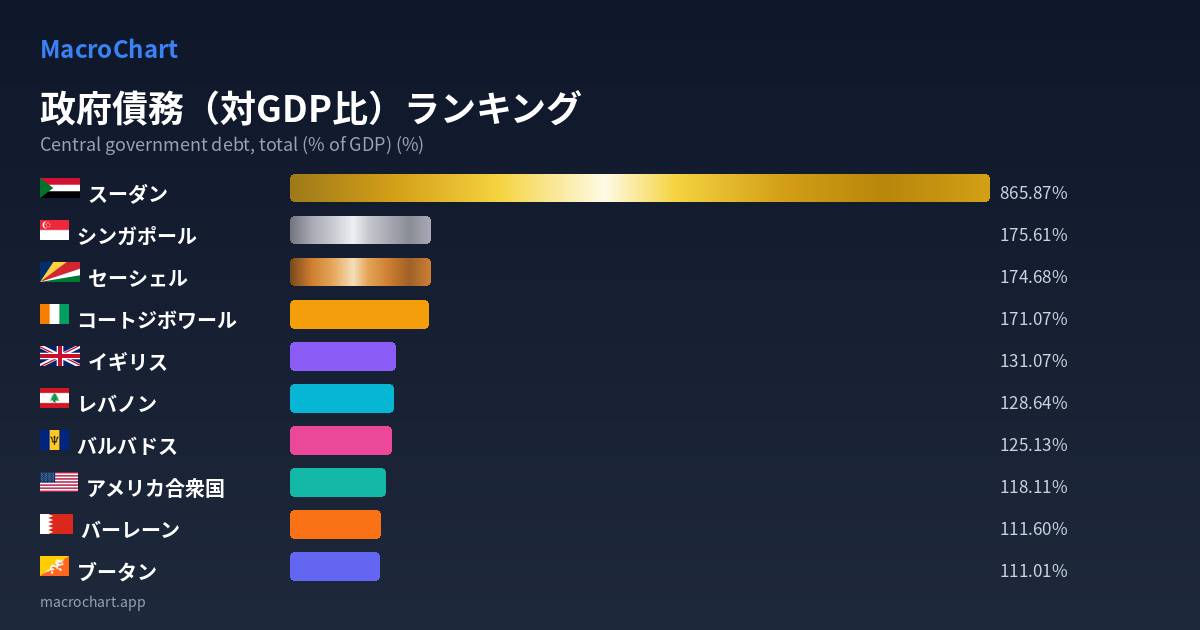
Central government debt, total (% of GDP) (%)
Die Staatsschulden (im Verhältnis zum BIP) sind ein Indikator, der die Höhe der Staatsschulden im Verhältnis zur Wirtschaftsgröße eines Landes (BIP) darstellt. Je höher die Quote ist, desto mehr Schulden trägt die Regierung und desto größer ist die Schuldenlast im Verhältnis zu ihrer Rückzahlungsfähigkeit. In entwickelten Ländern wie Japan und Italien ist die Quote tendenziell hoch, da die Ausgaben für Sozialversicherungen und öffentliche Investitionen die Einnahmen übersteigen. Andererseits haben Länder wie Australien und Kanada mit niedrigeren Quoten in der Regel eine solide Finanzwirtschaft und stabiles Wirtschaftswachstum. Allerdings kann bei gleicher Quote die tatsächliche Rückzahlungslast je nach Zinsumfeld und Währungswert von Land zu Land unterschiedlich sein.
108 Länder
| # | Land | Wert (%) | Jahr | |
|---|---|---|---|---|
| 🥇 |
|
865.87% | 1999 | |
| 🥈 |
|
175.61% | 2024 | |
| 🥉 |
|
174.68% | 2008 | |
| 4 |
|
171.07% | 1995 | |
| 5 |
|
131.07% | 2024 | |
| 6 |
|
128.64% | 1999 | |
| 7 |
|
125.13% | 2016 | |
| 8 |
|
118.11% | 2024 | |
| 9 |
|
111.60% | 2020 | |
| 10 |
|
111.01% | 2020 | |
| 11 |
|
107.30% | 2023 | |
| 12 |
|
105.80% | 2024 | |
| 13 |
|
102.85% | 2023 | |
| 14 |
|
99.87% | 2023 | |
| 15 |
|
97.87% | 2020 | |
| 16 |
|
88.24% | 1999 | |
| 17 |
|
85.79% | 2007 | |
| 18 |
|
85.17% | 2019 | |
| 19 |
|
81.92% | 2021 | |
| 20 |
|
81.86% | 2024 | |
| 21 |
|
80.16% | 2023 | |
| 22 |
|
79.80% | 2001 | |
| 23 |
|
79.46% | 1999 | |
| 24 |
|
79.45% | 2023 | |
| 25 |
|
77.29% | 1992 | |
| 26 |
|
75.53% | 2022 | |
| 27 |
|
75.33% | 1994 | |
| 28 |
|
73.73% | 2023 | |
| 29 |
|
73.51% | 2015 | |
| 30 |
|
72.32% | 2023 | |
| 31 |
|
71.79% | 2024 | |
| 32 |
|
71.48% | 2024 | |
| 33 |
|
71.41% | 2021 | |
| 34 |
|
68.34% | 2001 | |
| 35 |
|
66.40% | 2024 | |
| 36 |
|
64.90% | 2024 | |
| 37 |
|
64.28% | 2023 | |
| 38 |
|
62.20% | 2024 | |
| 39 |
|
61.93% | 2023 | |
| 40 |
|
61.03% | 2014 | |
| 41 |
|
60.45% | 1994 | |
| 42 |
|
58.72% | 2020 | |
| 43 |
|
58.31% | 1994 | |
| 44 |
|
57.88% | 2022 | |
| 45 |
|
57.67% | 2014 | |
| 46 |
|
57.30% | 2011 | |
| 47 |
|
57.13% | 2019 | |
| 48 |
|
55.60% | 2022 | |
| 49 |
|
55.03% | 2000 | |
| 50 |
|
54.21% | 1994 | |
| 51 |
|
54.05% | 2023 | |
| 52 |
|
53.70% | 2009 | |
| 53 |
|
53.65% | 1994 | |
| 54 |
|
53.15% | 2023 | |
| 55 |
|
52.38% | 2023 | |
| 56 |
|
51.23% | 2011 | |
| 57 |
|
50.34% | 2023 | |
| 58 |
|
48.55% | 2023 | |
| 59 |
|
48.43% | 1992 | |
| 60 |
|
47.88% | 2024 | |
| 61 |
|
46.52% | 2018 | |
| 62 |
|
45.86% | 2010 | |
| 63 |
|
45.03% | 2023 | |
| 64 |
|
43.43% | 2014 | |
| 65 |
|
43.34% | 2024 | |
| 66 |
|
43.08% | 2020 | |
| 67 |
|
42.52% | 2012 | |
| 68 |
|
41.56% | 2019 | |
| 69 |
|
40.23% | 2024 | |
| 70 |
|
40.10% | 2024 | |
| 71 |
|
39.92% | 2021 | |
| 72 |
|
39.91% | 2024 | |
| 73 |
|
39.34% | 2001 | |
| 74 |
|
36.63% | 1994 | |
| 75 |
|
35.72% | 2021 | |
| 76 |
|
35.25% | 2021 | |
| 77 |
|
34.26% | 2023 | |
| 78 |
|
33.24% | 2019 | |
| 79 |
|
31.45% | 2019 | |
| 80 |
|
31.20% | 2003 | |
| 81 |
|
30.75% | 1994 | |
| 82 |
|
30.00% | 2009 | |
| 83 |
|
29.97% | 1994 | |
| 84 |
|
27.80% | 2020 | |
| 85 |
|
27.44% | 2018 | |
| 86 |
|
26.62% | 2024 | |
| 87 |
|
25.48% | 2010 | |
| 88 |
|
25.21% | 2013 | |
| 89 |
|
20.89% | 2023 | |
| 90 |
|
20.85% | 1990 | |
| 91 |
|
19.88% | 2023 | |
| 92 |
|
19.62% | 2020 | |
| 93 |
|
18.50% | 2023 | |
| 94 |
|
16.44% | 2022 | |
| 95 |
|
16.42% | 1999 | |
| 96 |
|
16.24% | 1994 | |
| 97 |
|
15.93% | 2007 | |
| 98 |
|
14.94% | 2022 | |
| 99 |
|
14.00% | 1994 | |
| 100 |
|
13.15% | 2000 | |
| 101 |
|
7.45% | 1994 | |
| 102 |
|
6.39% | 2010 | |
| 103 |
|
5.66% | 1994 | |
| 104 |
|
4.67% | 2015 | |
| 105 |
|
2.99% | 2020 | |
| 106 |
|
2.90% | 1993 | |
| 107 |
|
1.80% | 2013 | |
| 108 |
|
0.00% | 2024 |