Unemployment rate (IMF) Ranking
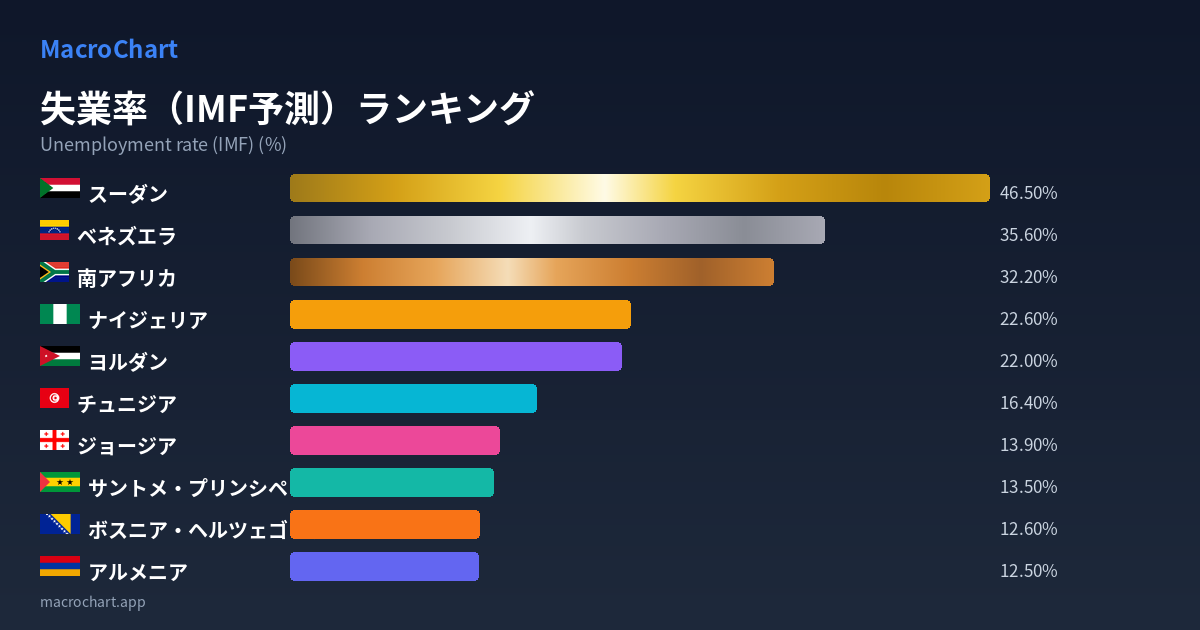
Unemployment rate (IMF) (%)
The unemployment rate (IMF forecast) is an important economic indicator showing the health of each country's labor market. A lower unemployment rate indicates more robust employment. Countries ranking high in the rankings (with low unemployment rates) are typically those with stable economies and advancing job creation, with advanced countries and performing emerging Asian economies commonly at the top. Conversely, those ranking low (with high unemployment rates) are countries facing economic challenges and structural problems, including those experiencing financial crises or undergoing industrial transitions. As these are future projections by the IMF, the forecasts reflect the outlook incorporating each country's economic trends and policy impacts, serving as a reference material for investment decisions and economic analysis.
115 countries
| # | Country | Value (%) | Year | |
|---|---|---|---|---|
| 🥇 |
|
46.50% | 2030 | |
| 🥈 |
|
35.60% | 2018 | |
| 🥉 |
|
32.20% | 2030 | |
| 4 |
|
22.60% | 2018 | |
| 5 |
|
22.00% | 2023 | |
| 6 |
|
16.40% | 2023 | |
| 7 |
|
13.90% | 2030 | |
| 8 |
|
13.50% | 2017 | |
| 9 |
|
12.60% | 2030 | |
| 10 |
|
12.50% | 2030 | |
| 11 |
|
12.10% | 2030 | |
| 12 |
|
11.60% | 2030 | |
| 13 |
|
11.50% | 2023 | |
| 14 |
|
11.40% | 2019 | |
| 15 |
|
10.70% | 2030 | |
| 16 |
|
9.40% | 2030 | |
| 17 |
|
9.10% | 2030 | |
| 18 |
|
9.00% | 2030 | |
| 19 |
|
9.00% | 2030 | |
| 20 |
|
8.70% | 2030 | |
| 21 |
|
8.60% | 2010 | |
| 22 |
|
8.50% | 2030 | |
| 23 |
|
8.50% | 2030 | |
| 24 |
|
8.50% | 2030 | |
| 25 |
|
8.30% | 2030 | |
| 26 |
|
8.20% | 2030 | |
| 27 |
|
8.00% | 2030 | |
| 28 |
|
8.00% | 2030 | |
| 29 |
|
7.90% | 2030 | |
| 30 |
|
7.90% | 2030 | |
| 31 |
|
7.80% | 2030 | |
| 32 |
|
7.70% | 2030 | |
| 33 |
|
7.70% | 2030 | |
| 34 |
|
7.40% | 2030 | |
| 35 |
|
7.20% | 2030 | |
| 36 |
|
7.00% | 2030 | |
| 37 |
|
7.00% | 2030 | |
| 38 |
|
6.80% | 2030 | |
| 39 |
|
6.50% | 2030 | |
| 40 |
|
6.50% | 2030 | |
| 41 |
|
6.40% | 2030 | |
| 42 |
|
6.30% | 2030 | |
| 43 |
|
6.20% | 2024 | |
| 44 |
|
6.20% | 2030 | |
| 45 |
|
6.00% | 2030 | |
| 46 |
|
5.90% | 2030 | |
| 47 |
|
5.90% | 2030 | |
| 48 |
|
5.90% | 2030 | |
| 49 |
|
5.80% | 2030 | |
| 50 |
|
5.70% | 2030 | |
| 51 |
|
5.60% | 2030 | |
| 52 |
|
5.30% | 2030 | |
| 53 |
|
5.20% | 2030 | |
| 54 |
|
5.10% | 2030 | |
| 55 |
|
5.10% | 2025 | |
| 56 |
|
5.00% | 2030 | |
| 57 |
|
5.00% | 2030 | |
| 58 |
|
5.00% | 2030 | |
| 59 |
|
5.00% | 2030 | |
| 60 |
|
5.00% | 2030 | |
| 61 |
|
5.00% | 2030 | |
| 62 |
|
5.00% | 2030 | |
| 63 |
|
5.00% | 2030 | |
| 64 |
|
4.90% | 2030 | |
| 65 |
|
4.80% | 2030 | |
| 66 |
|
4.80% | 2024 | |
| 67 |
|
4.80% | 2030 | |
| 68 |
|
4.70% | 2030 | |
| 69 |
|
4.70% | 2030 | |
| 70 |
|
4.50% | 2030 | |
| 71 |
|
4.50% | 2030 | |
| 72 |
|
4.50% | 2030 | |
| 73 |
|
4.40% | 2030 | |
| 74 |
|
4.40% | 2030 | |
| 75 |
|
4.40% | 2030 | |
| 76 |
|
4.30% | 2030 | |
| 77 |
|
4.20% | 2024 | |
| 78 |
|
4.10% | 2030 | |
| 79 |
|
4.10% | 2030 | |
| 80 |
|
4.00% | 2030 | |
| 81 |
|
4.00% | 2030 | |
| 82 |
|
4.00% | 2030 | |
| 83 |
|
3.90% | 2030 | |
| 84 |
|
3.80% | 2030 | |
| 85 |
|
3.80% | 2030 | |
| 86 |
|
3.70% | 2030 | |
| 87 |
|
3.70% | 2030 | |
| 88 |
|
3.50% | 2030 | |
| 89 |
|
3.50% | 2024 | |
| 90 |
|
3.50% | 2023 | |
| 91 |
|
3.50% | 2030 | |
| 92 |
|
3.40% | 2030 | |
| 93 |
|
3.20% | 2030 | |
| 94 |
|
3.20% | 2030 | |
| 95 |
|
3.10% | 2030 | |
| 96 |
|
3.00% | 2030 | |
| 97 |
|
3.00% | 2030 | |
| 98 |
|
3.00% | 2030 | |
| 99 |
|
3.00% | 2030 | |
| 100 |
|
2.90% | 2030 | |
| 101 |
|
2.90% | 2030 | |
| 102 |
|
2.80% | 2030 | |
| 103 |
|
2.80% | 2030 | |
| 104 |
|
2.80% | 2030 | |
| 105 |
|
2.70% | 2030 | |
| 106 |
|
2.60% | 2030 | |
| 107 |
|
2.60% | 2030 | |
| 108 |
|
2.50% | 2011 | |
| 109 |
|
2.50% | 2030 | |
| 110 |
|
2.40% | 2030 | |
| 111 |
|
2.20% | 2030 | |
| 112 |
|
2.10% | 2030 | |
| 113 |
|
1.70% | 2030 | |
| 114 |
|
1.60% | 2030 | |
| 115 |
|
1.00% | 2030 |