Central government debt, total (% of GDP) Ranking
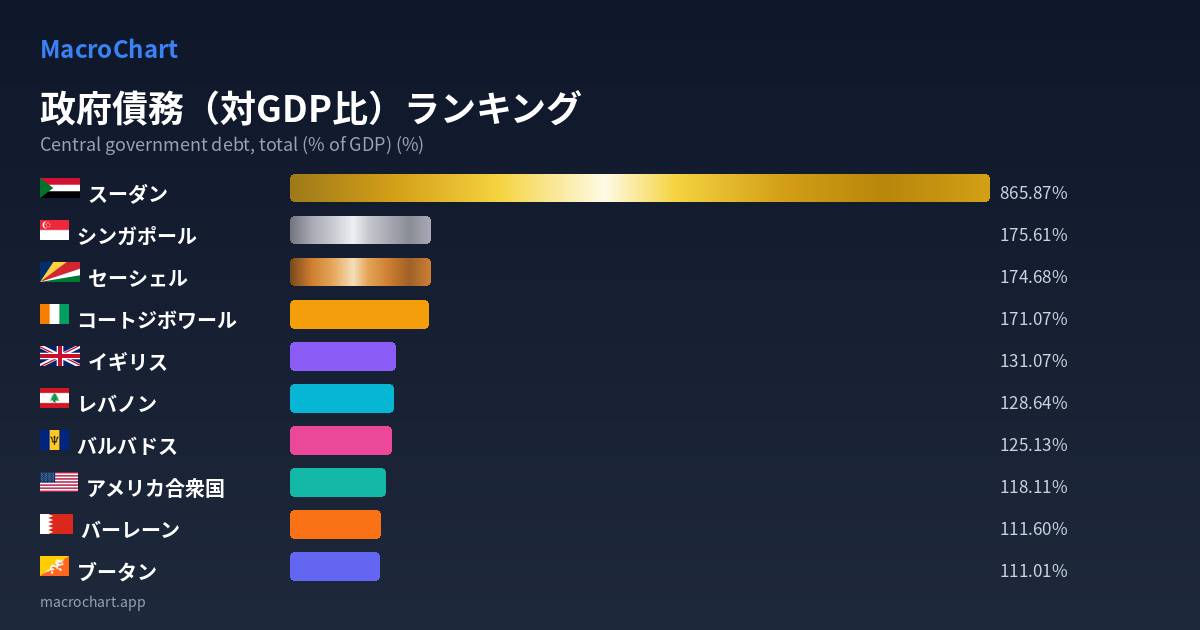
Central government debt, total (% of GDP) (%)
Government debt (% of GDP) is an indicator that shows the ratio of government debt to the country's economic scale (GDP). The higher the ratio, the more debt the government carries, indicating a larger debt burden relative to its repayment capacity. Advanced countries such as Japan and Italy tend to have high ratios, with government expenditures exceeding revenues due to social security spending and public investment. Conversely, countries with lower ratios such as Australia and Canada often have sound fiscal management and stable economic growth. However, even with the same ratio, the actual debt repayment burden varies by country depending on interest rate environments and currency values.
108 countries
| # | Country | Value (%) | Year | |
|---|---|---|---|---|
| 🥇 |
|
865.87% | 1999 | |
| 🥈 |
|
175.61% | 2024 | |
| 🥉 |
|
174.68% | 2008 | |
| 4 |
|
171.07% | 1995 | |
| 5 |
|
131.07% | 2024 | |
| 6 |
|
128.64% | 1999 | |
| 7 |
|
125.13% | 2016 | |
| 8 |
|
118.11% | 2024 | |
| 9 |
|
111.60% | 2020 | |
| 10 |
|
111.01% | 2020 | |
| 11 |
|
107.30% | 2023 | |
| 12 |
|
105.80% | 2024 | |
| 13 |
|
102.85% | 2023 | |
| 14 |
|
99.87% | 2023 | |
| 15 |
|
97.87% | 2020 | |
| 16 |
|
88.24% | 1999 | |
| 17 |
|
85.79% | 2007 | |
| 18 |
|
85.17% | 2019 | |
| 19 |
|
81.92% | 2021 | |
| 20 |
|
81.86% | 2024 | |
| 21 |
|
80.16% | 2023 | |
| 22 |
|
79.80% | 2001 | |
| 23 |
|
79.46% | 1999 | |
| 24 |
|
79.45% | 2023 | |
| 25 |
|
77.29% | 1992 | |
| 26 |
|
75.53% | 2022 | |
| 27 |
|
75.33% | 1994 | |
| 28 |
|
73.73% | 2023 | |
| 29 |
|
73.51% | 2015 | |
| 30 |
|
72.32% | 2023 | |
| 31 |
|
71.79% | 2024 | |
| 32 |
|
71.48% | 2024 | |
| 33 |
|
71.41% | 2021 | |
| 34 |
|
68.34% | 2001 | |
| 35 |
|
66.40% | 2024 | |
| 36 |
|
64.90% | 2024 | |
| 37 |
|
64.28% | 2023 | |
| 38 |
|
62.20% | 2024 | |
| 39 |
|
61.93% | 2023 | |
| 40 |
|
61.03% | 2014 | |
| 41 |
|
60.45% | 1994 | |
| 42 |
|
58.72% | 2020 | |
| 43 |
|
58.31% | 1994 | |
| 44 |
|
57.88% | 2022 | |
| 45 |
|
57.67% | 2014 | |
| 46 |
|
57.30% | 2011 | |
| 47 |
|
57.13% | 2019 | |
| 48 |
|
55.60% | 2022 | |
| 49 |
|
55.03% | 2000 | |
| 50 |
|
54.21% | 1994 | |
| 51 |
|
54.05% | 2023 | |
| 52 |
|
53.70% | 2009 | |
| 53 |
|
53.65% | 1994 | |
| 54 |
|
53.15% | 2023 | |
| 55 |
|
52.38% | 2023 | |
| 56 |
|
51.23% | 2011 | |
| 57 |
|
50.34% | 2023 | |
| 58 |
|
48.55% | 2023 | |
| 59 |
|
48.43% | 1992 | |
| 60 |
|
47.88% | 2024 | |
| 61 |
|
46.52% | 2018 | |
| 62 |
|
45.86% | 2010 | |
| 63 |
|
45.03% | 2023 | |
| 64 |
|
43.43% | 2014 | |
| 65 |
|
43.34% | 2024 | |
| 66 |
|
43.08% | 2020 | |
| 67 |
|
42.52% | 2012 | |
| 68 |
|
41.56% | 2019 | |
| 69 |
|
40.23% | 2024 | |
| 70 |
|
40.10% | 2024 | |
| 71 |
|
39.92% | 2021 | |
| 72 |
|
39.91% | 2024 | |
| 73 |
|
39.34% | 2001 | |
| 74 |
|
36.63% | 1994 | |
| 75 |
|
35.72% | 2021 | |
| 76 |
|
35.25% | 2021 | |
| 77 |
|
34.26% | 2023 | |
| 78 |
|
33.24% | 2019 | |
| 79 |
|
31.45% | 2019 | |
| 80 |
|
31.20% | 2003 | |
| 81 |
|
30.75% | 1994 | |
| 82 |
|
30.00% | 2009 | |
| 83 |
|
29.97% | 1994 | |
| 84 |
|
27.80% | 2020 | |
| 85 |
|
27.44% | 2018 | |
| 86 |
|
26.62% | 2024 | |
| 87 |
|
25.48% | 2010 | |
| 88 |
|
25.21% | 2013 | |
| 89 |
|
20.89% | 2023 | |
| 90 |
|
20.85% | 1990 | |
| 91 |
|
19.88% | 2023 | |
| 92 |
|
19.62% | 2020 | |
| 93 |
|
18.50% | 2023 | |
| 94 |
|
16.44% | 2022 | |
| 95 |
|
16.42% | 1999 | |
| 96 |
|
16.24% | 1994 | |
| 97 |
|
15.93% | 2007 | |
| 98 |
|
14.94% | 2022 | |
| 99 |
|
14.00% | 1994 | |
| 100 |
|
13.15% | 2000 | |
| 101 |
|
7.45% | 1994 | |
| 102 |
|
6.39% | 2010 | |
| 103 |
|
5.66% | 1994 | |
| 104 |
|
4.67% | 2015 | |
| 105 |
|
2.99% | 2020 | |
| 106 |
|
2.90% | 1993 | |
| 107 |
|
1.80% | 2013 | |
| 108 |
|
0.00% | 2024 |